Before we delve into the transformative power of visuals in customer care, a few words on Sweepr—we are AI-powered digital customer platform. Sweepr is revolutionizing the service provider and smart home industries by transforming complex customer interactions into simple digital journeys. With a focus on personalization and user-friendly navigation, Sweepr’s platform is designed to empower users and streamline support, setting new standards in the customer experience.
As a customer care leader, do you struggle with customer engagement with your digital channels? Visual didactics might be your answer.
In the digital realm, customer experience (CX) is king. But how do you captivate and educate your customers? Sweepr believes the answer lies in visual learning. Here’s why:
Visuals Triumph:
Humans are visual beings — 65% of us are visual learners (Cohen). We process visuals 60,000 times faster than text, making visual didactics not just smart, but natural (Taei).
Retention through Visualization:
Want to lock in learning? Use visuals. They can increase retention by 78% (Ezera).
Teach, Don’t Tell:
A visual didactic approach simplifies complex ideas, transforming customer care from confusing to clear (Yarbrough).
Sweepr’s Visual Strategy
Sweepr integrates visuals, personalization, and guided navigation to revolutionize digital care, crafting a CX that’s as intuitive as it is effective. Here’s how Sweepr stands out:
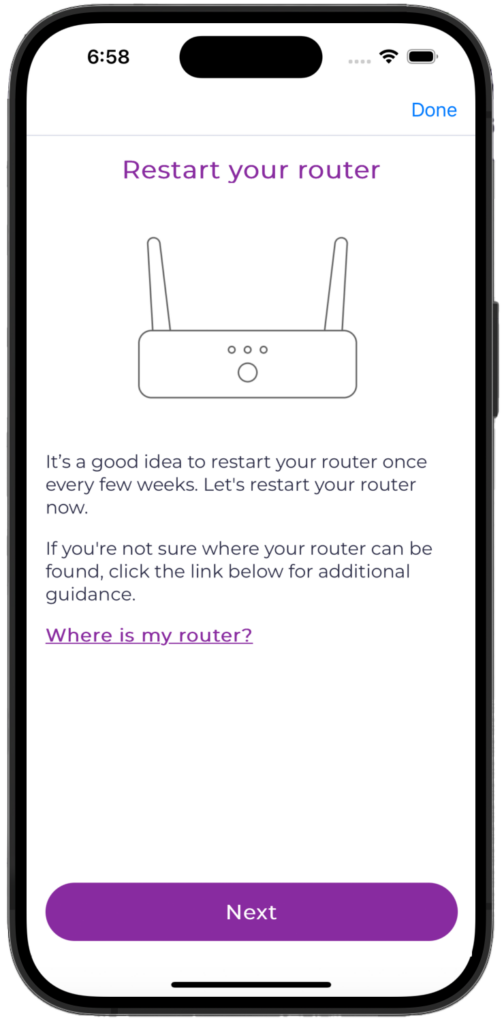
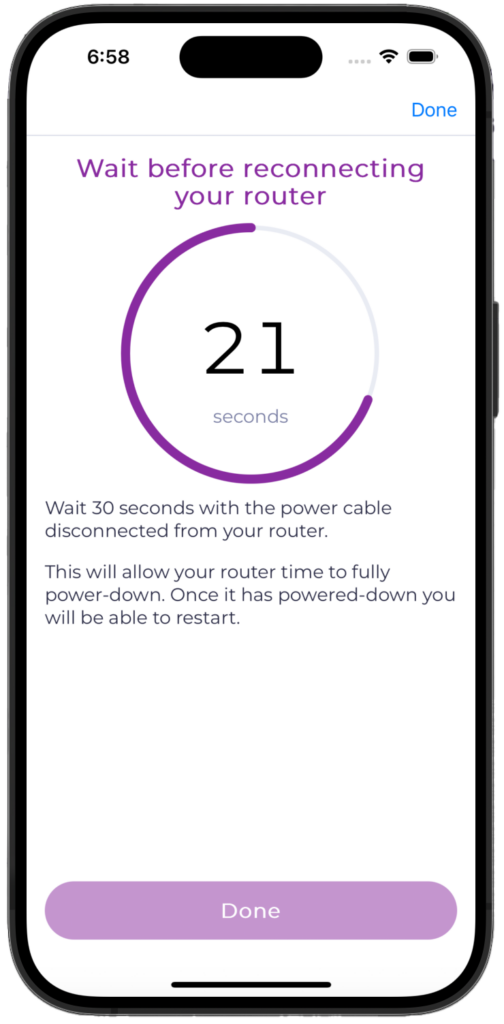
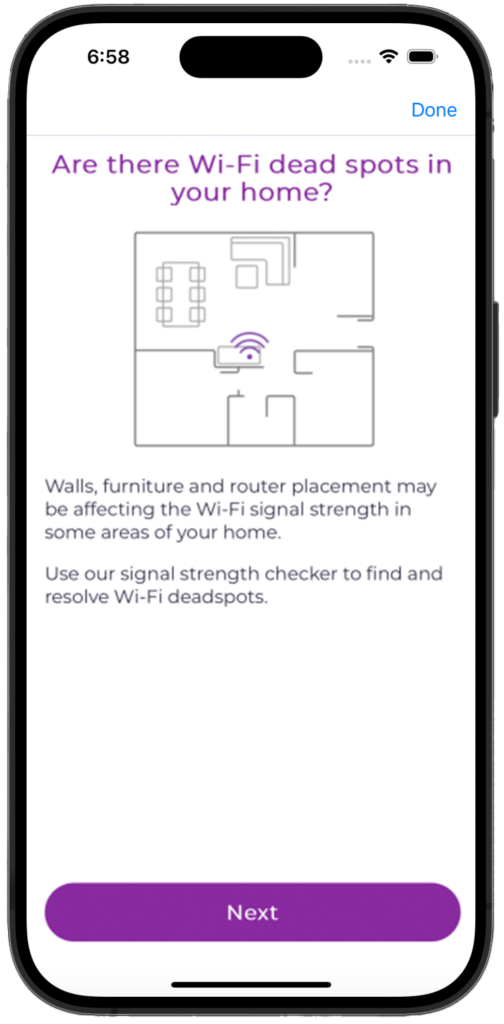
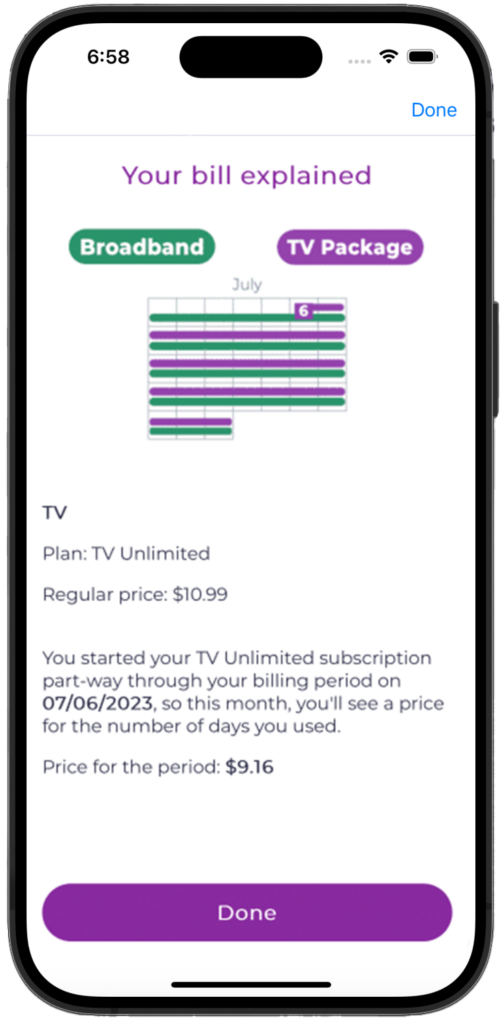
Simplifying Complexities:
We break down tasks into easy-to-digest visual steps.
Guided Discovery:
Using topic-led queries (Fornell Haugeland et al.), we pinpoint customer intent, then switch to a task-led visual guide for a noise-free, focused experience.
Personalized Visuals:
Our platform dynamically adjusts visuals and guidance, enhancing CX with insights into each customer’s technical aptitude and confidence levels.
Sweepr can introduce personalization in the content and logic presented to the subscriber based on data obtained from backend system integrations. The platform also generates its own personalization data points such as Technical Aptitude, Digital Patience and Sentiment based on current and historical behavior within Sweepr’s experiences.
In this example, Technical Aptitude is used to evaluate whether a customer should be sent a self-install kit or should have an appointment with a technician. Then, using a VIP flag from the CRM, Sweepr decides when to offer a discount.
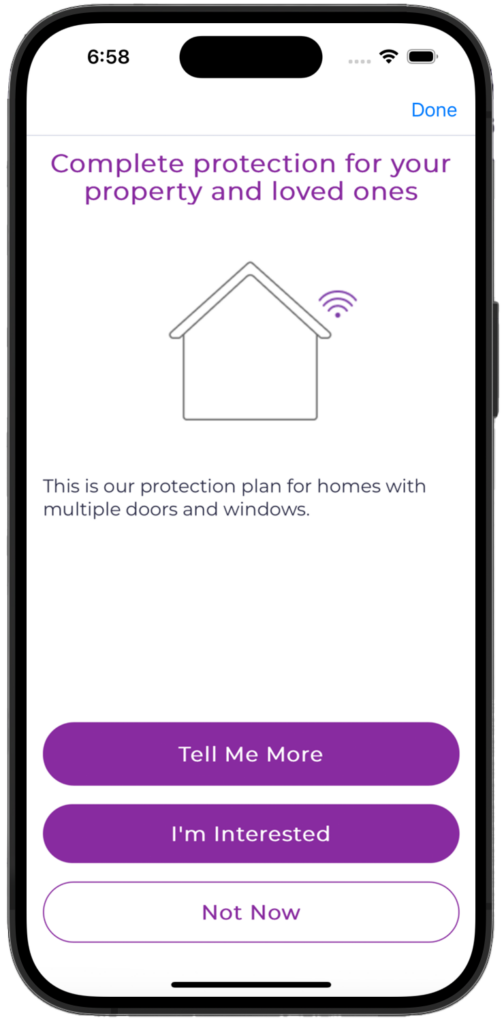
Home Security high tech aptitude VIP customer
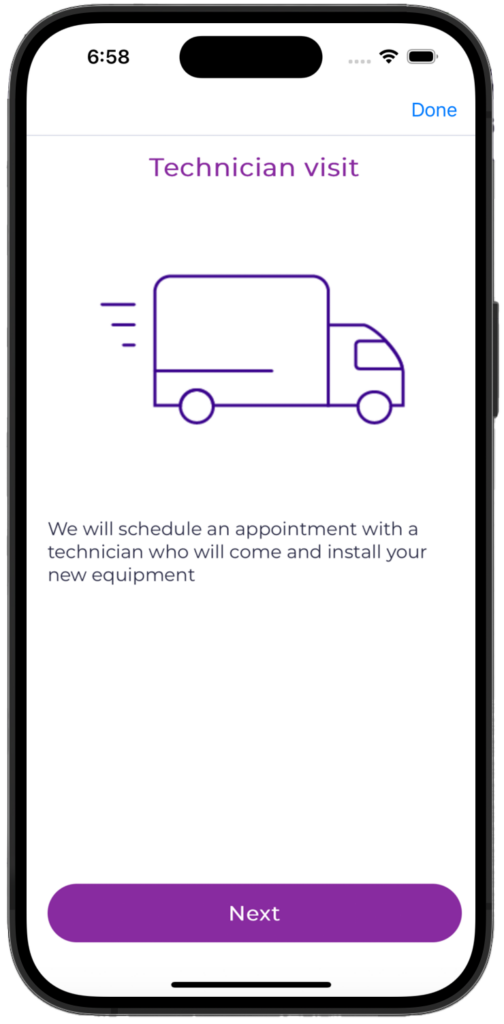
Home Security low tech aptitude VIP customer
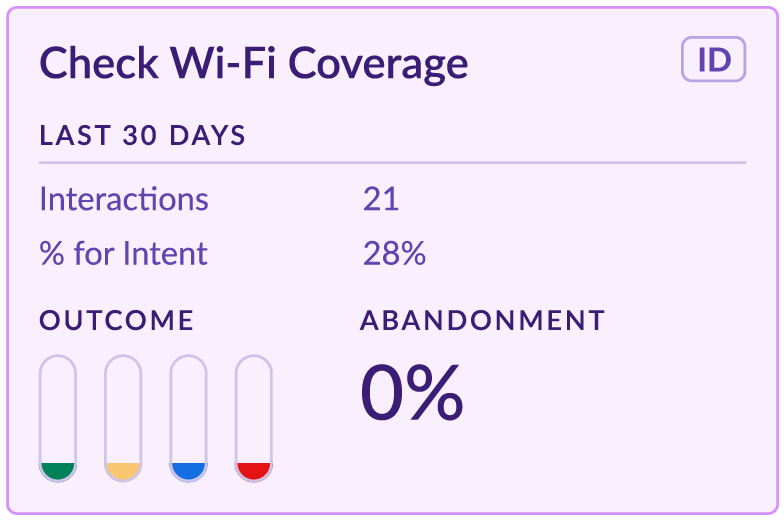
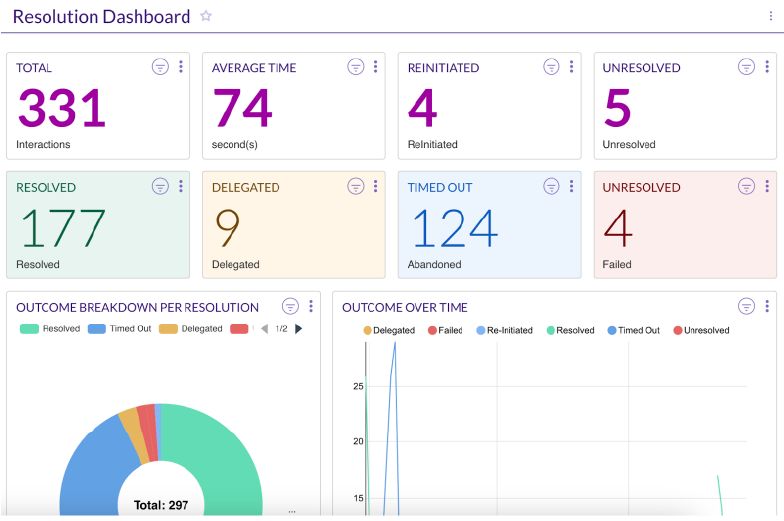
Insight-Driven Choices:
Analytics support our communication strategy, revealing when a visual method shines over conversational flows.
Visual Didactics in Action:
Imagine this—instead of navigating a maze of conversational commands, customers interact with clear, visually-aided steps. The result? Quicker resolutions, empowered customers, and a CX that not only satisfies but impresses (Fornell Haugeland et al.).
Ready to see the difference? Dive deeper into our approach and witness the transformation in action with Sweepr’s solutions. Join us in redefining customer care — visually.
To find out more, visit us at https://sweepr.com/ to book a tour or contact me directly at stephane.muszynski@sweepr.com
Works Cited
Cohen, Diana. “Studies Confirm the Power of Visuals to Engage Your Audience in eLearning.” Shift eLearning, https://www.shiftelearning.com/blog/bid/350326/studies-confirm-the-power-of-visuals-in-elearning
Ezera, Anete. “How to use infographics in the classroom: 10 infographics examples for students.” Infogram, 17 August 2022, https://infogram.com/blog/how-to-use-infographics-in-the-classroom/
Fornell Haugeland, Isabel Kathleen, et al. “,.” , – YouTube, 5 November 2023, https://www.sciencedirect.com/science/article/pii/S1071581922000179
Taei, Payman. “Do Infographics Increase Reading Comprehension and Recall? | by Payman Taei.” Towards Data Science, https://towardsdatascience.com/do-infographics-increase-reading-comprehension-and-recall-6e892c870a7bYarbrough, Jillian Ruth. “Infographics: In Support of Online Visual Learning.” Allied Business Academies, https://www.abacademies.org/articles/infographics-in-support-of-online-visual-learning-8368.html
Related Articles

Sweepr: Why you should consider it to elevate your customer care, even if you already have an AI-powered chat in place
Sweepr doesn't replace your AI investment – it supercharges it. Bringing industry-leading telecom intelligence to the tools you already rely on.
Plume to Deliver the Only Open Agentic AI Platform that Supports the Complete ISP Customer Journey
Plume has announced a major evolution of its platform, delivering the industry’s only open, vendor-agnostic agentic AI orchestration solution that autonomously monitors, diagnoses, and resolves ISP network issues across the full customer lifecycle.
Subscribe
For more content from industry experts including blogs,
webinars, Q&A sessions and news about live events, please subscribe below